Incident metrics that provide total transparency
Take complete control of when incident metrics are displayed and provide simple and meaningful metrics to those who want them.


Accurate incident metrics displayed on your Status Page


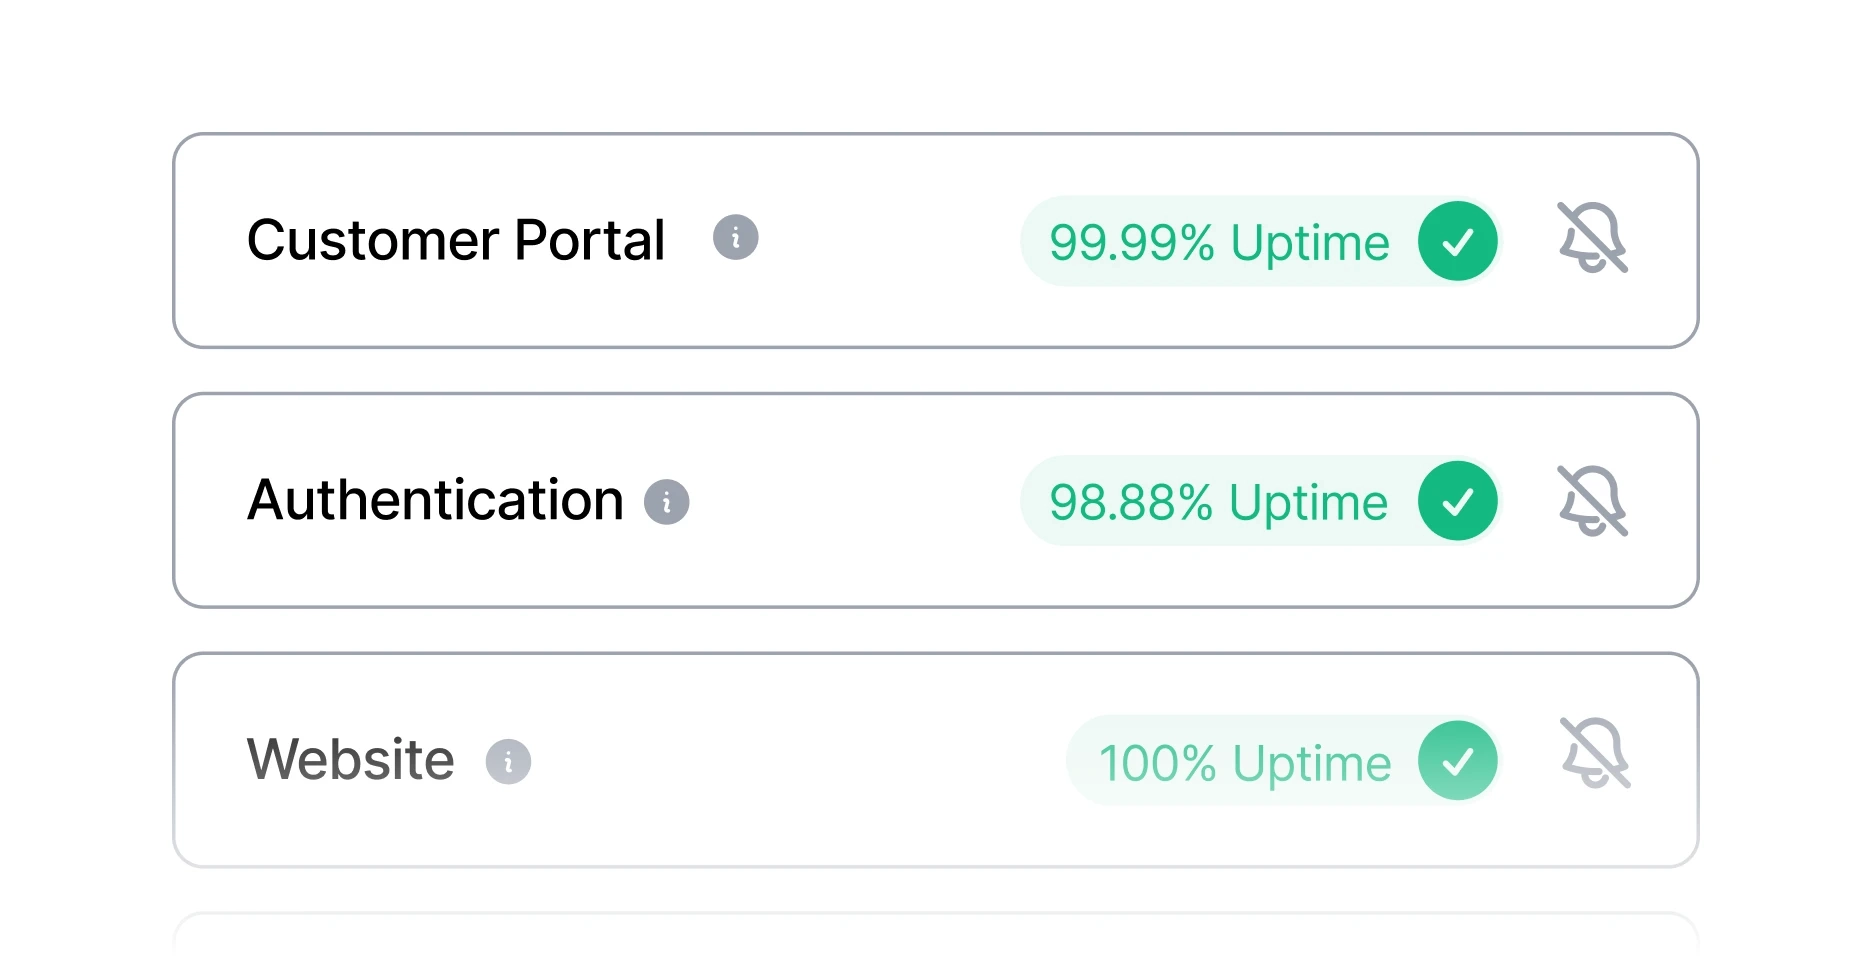


Transparent uptime displays
Well-designed and easy to understand uptime metrics for each status page component.

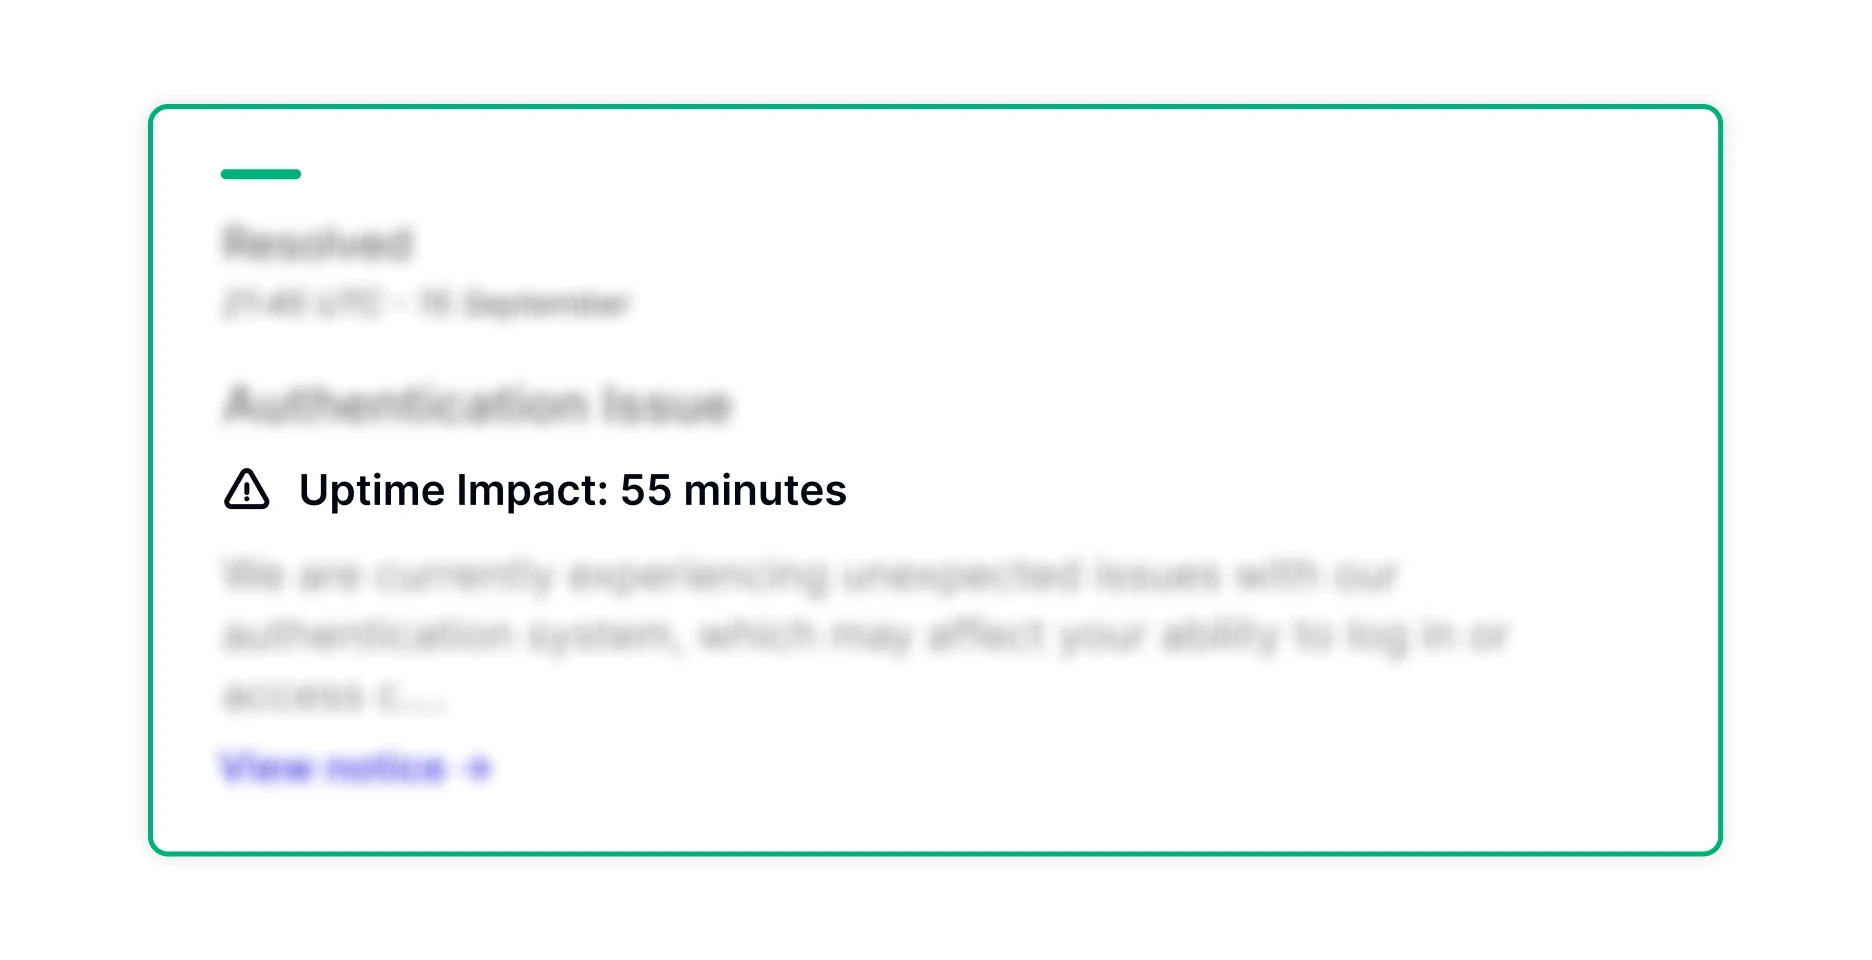


Trustworthy impact time
Added clarity to incident communication helps customers fully understand the impact.

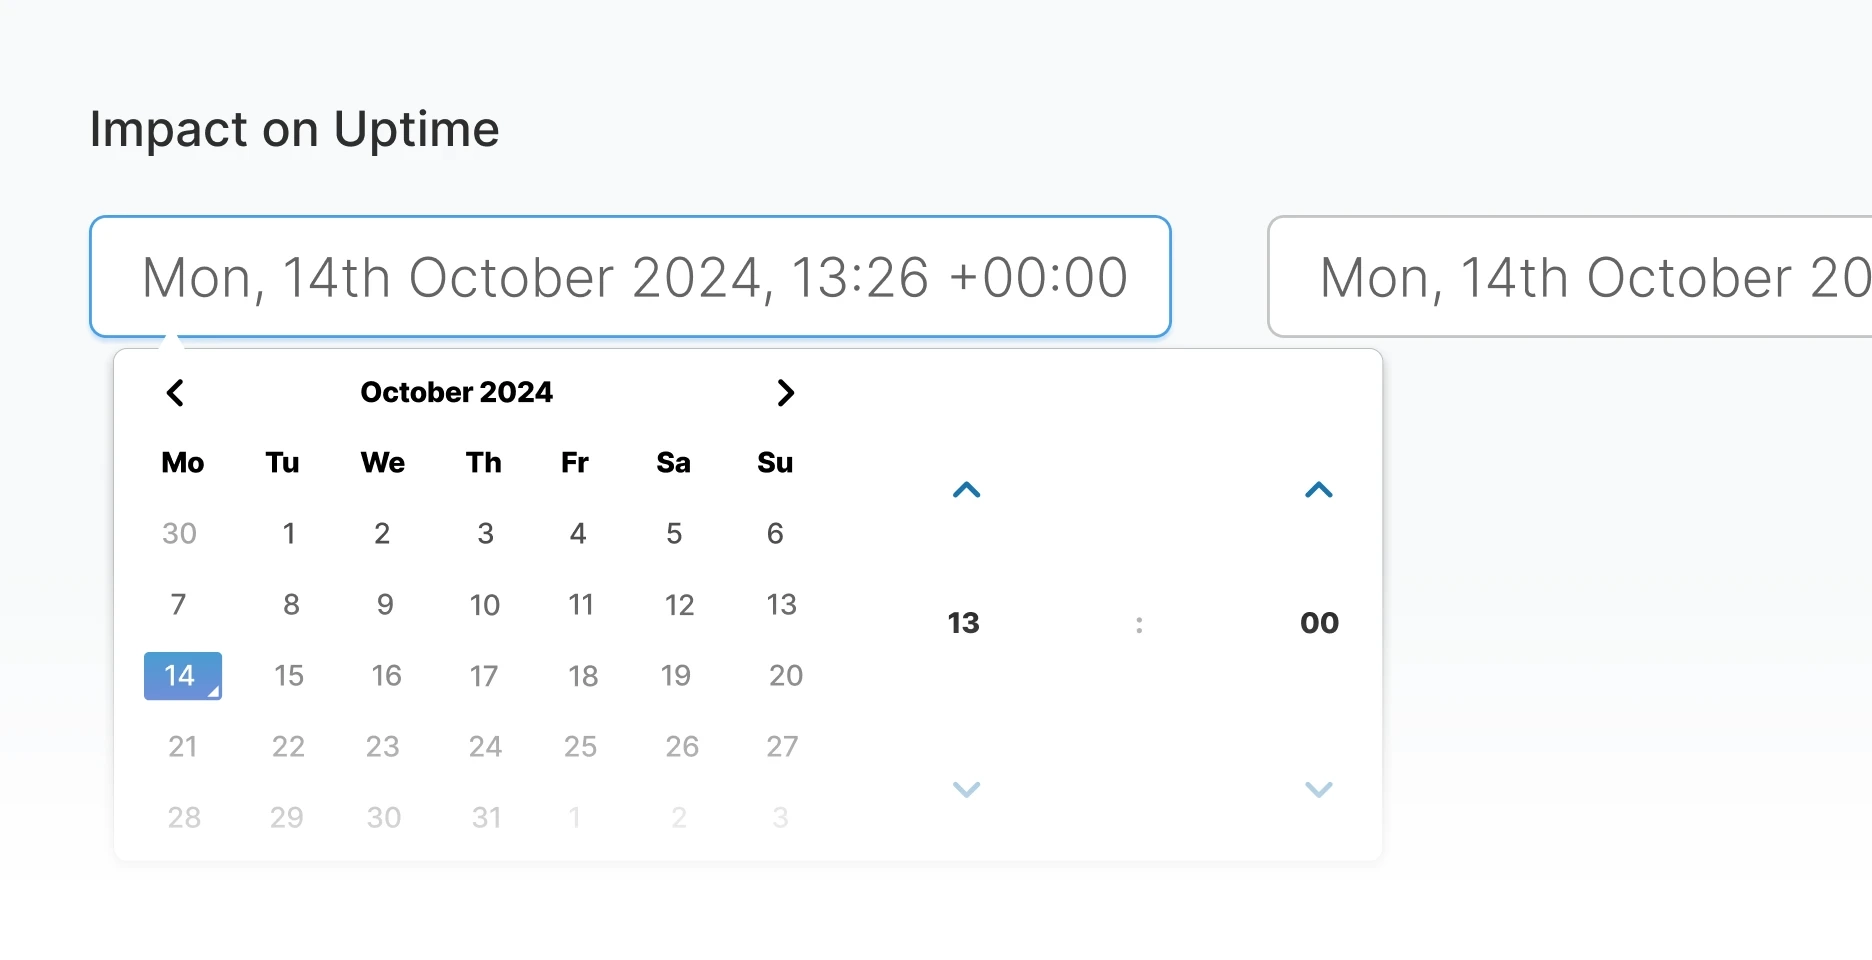


Complete control over the timeline
Take complete control over the real impact time to deliver accurate incident metrics.


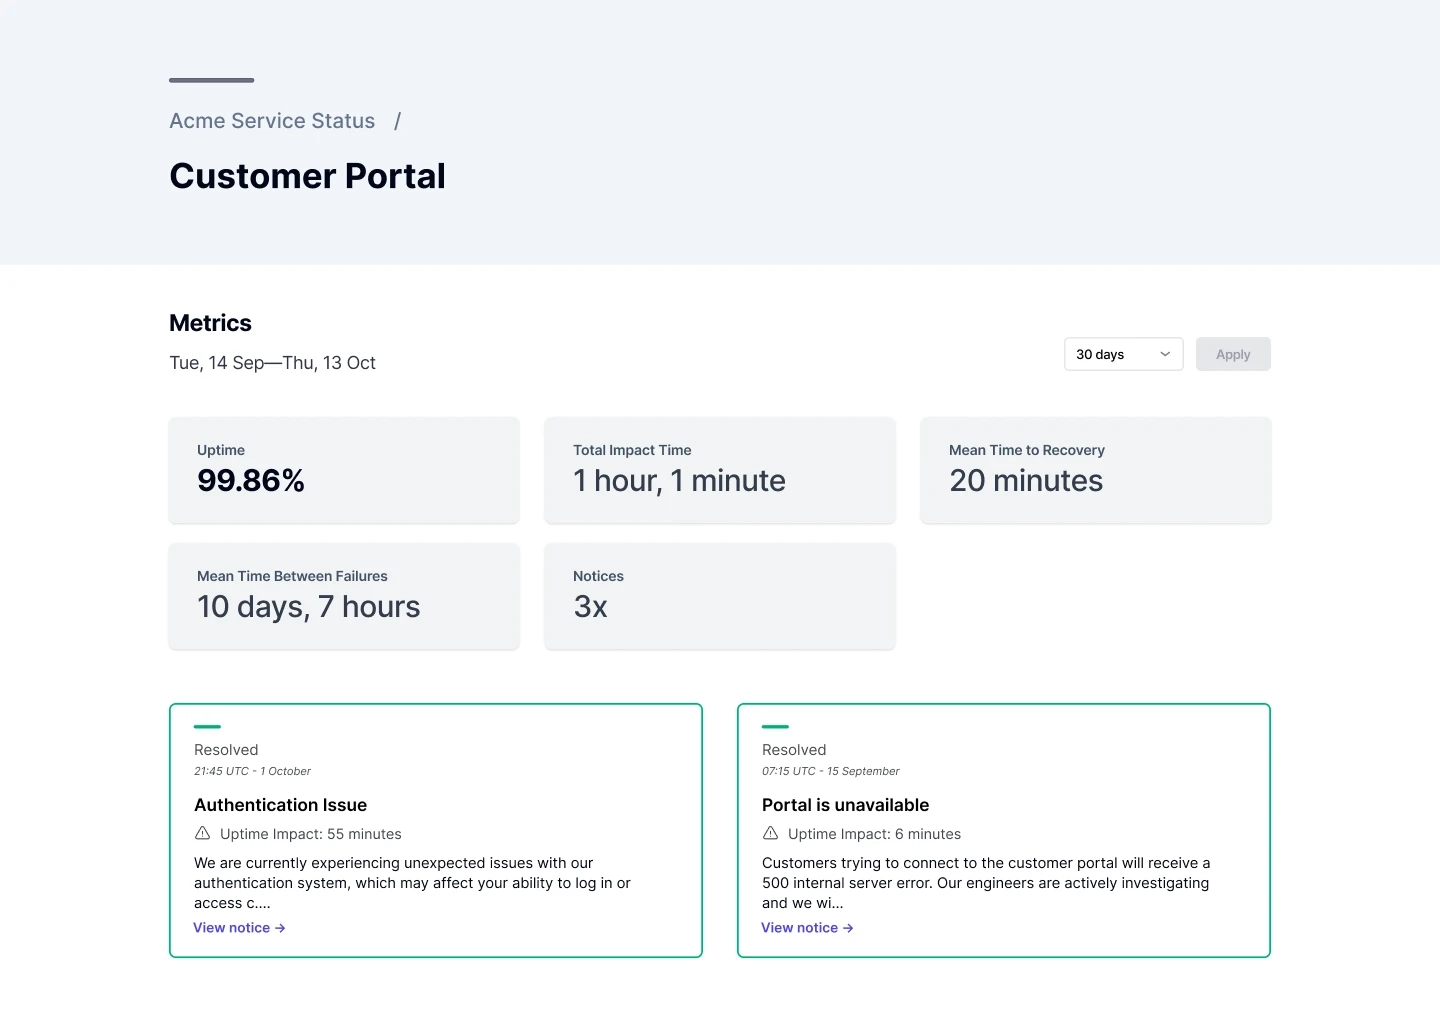
Meaningful performance insights
Dedicated built-in views for incident performance reports, including Uptime, Mean Time to Recovery (MTTR), Mean Time Between Failures (MTBF), and Impact Time.
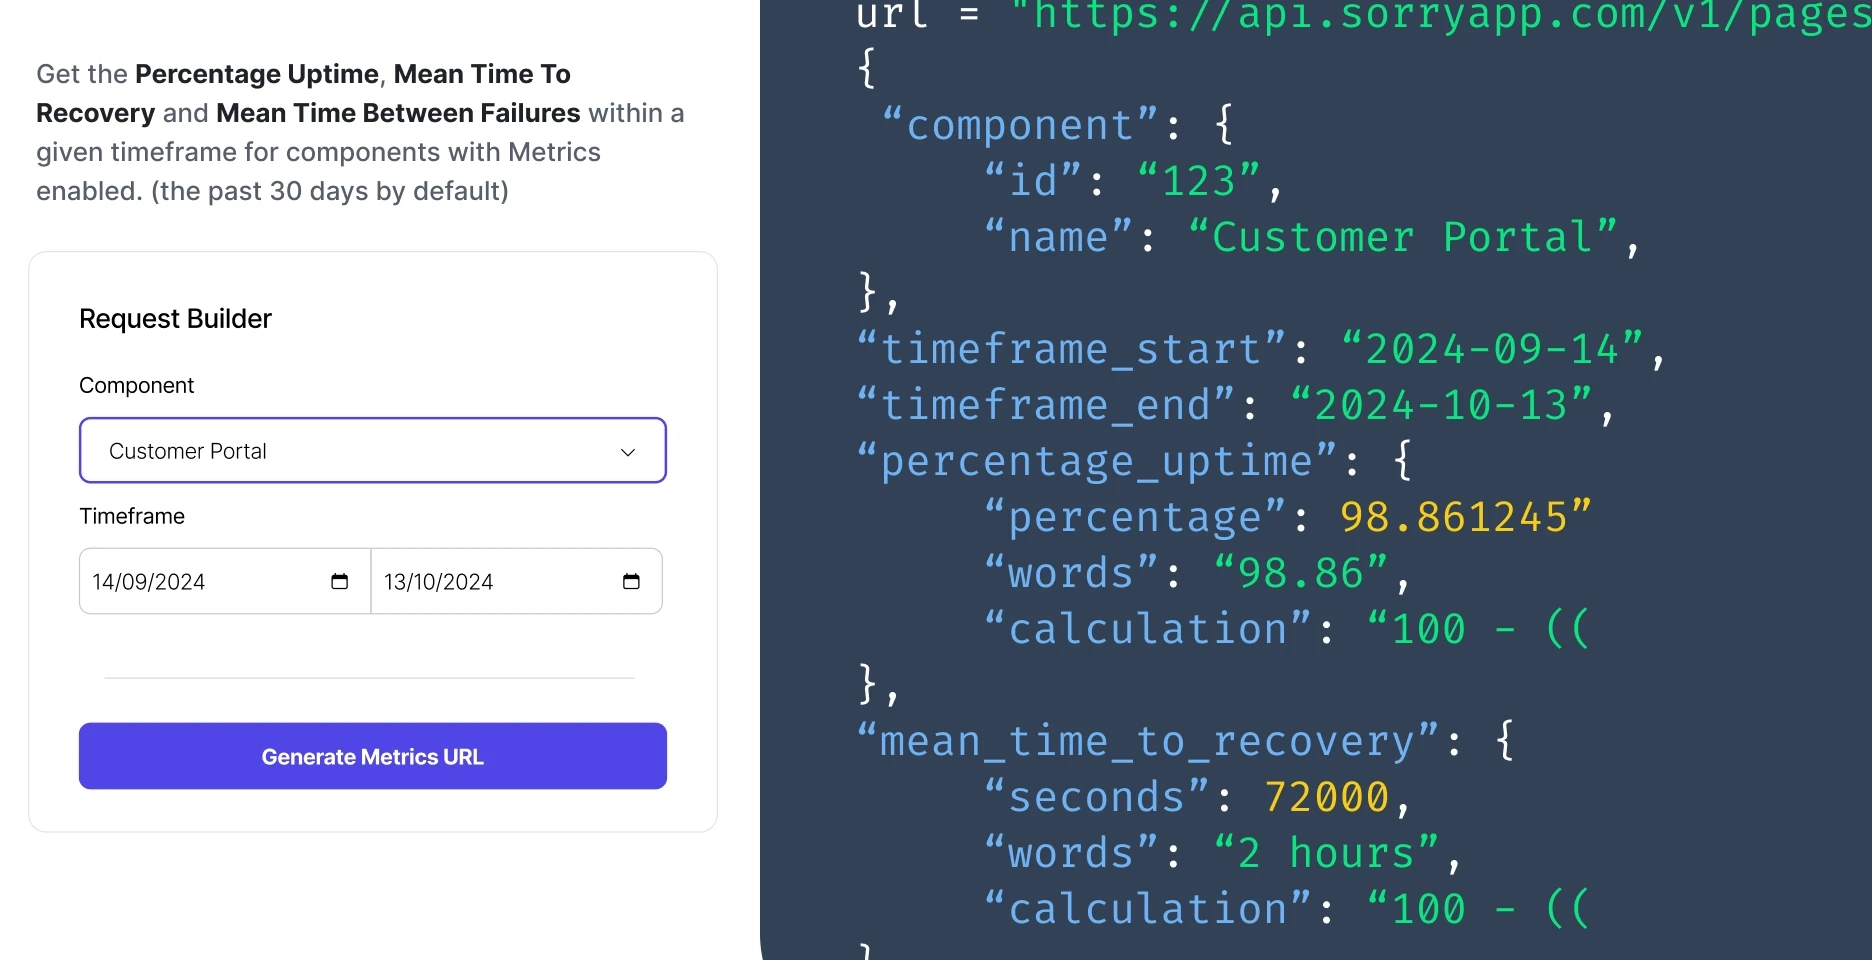
Custom metric reporting with the Status API
Developers can use the friendly request builder to return specific uptime data, using components and a date range as criteria. We produce the data in JSON format.


- Transparent uptime displays
- Trustworthy impact time
- Complete control over the timeline
- Meaningful performance insights